PPC Tips
Why Are Your Google Ads Leads Getting Worse? 7 Common Causes (and How to Fix Them)
Google's automation is an extremely powerful tool. However, it has a major limitation: it doesn't understand your business.

Beth Belcher
July 8, 2026

Explore the cost efficiency of Google Ads and Facebook Ads in 2025, comparing CPC, CPM, targeting options, and best use cases for
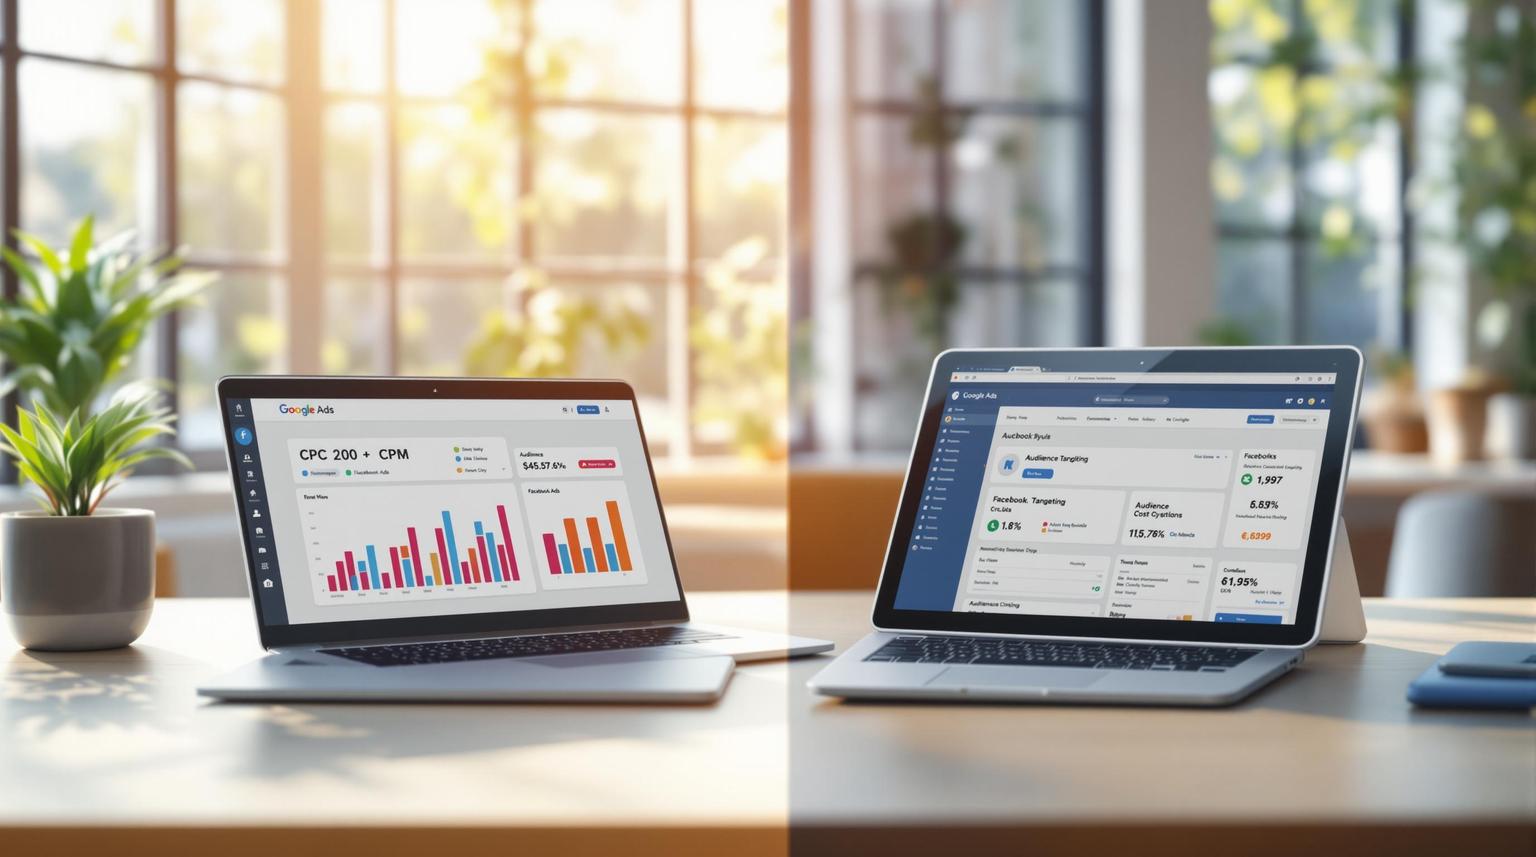
Which is better for your ad budget in 2025: Google Ads or Facebook Ads? Here’s the quick answer:
| Metric | Google Ads | Facebook Ads |
|---|---|---|
| Average CPC | $1–$4 | $0.26–$0.30 |
| Average CPM | $5–$12 | $1.01–$3.00 |
| Best Use Case | Direct response | Brand awareness |
| Targeting | Search intent | Demographics & interests |
| Monthly Budget | $500–$10,000 | $100–$500 |
The choice depends on your goals: Google Ads delivers high-intent conversions but costs more, while Facebook Ads offers affordable, engaging campaigns for broader audiences.
Google Ads operates on a pay-per-click (PPC) system, where costs depend on your bid, ad quality, and competition. The actual cost-per-click (CPC) is calculated using this formula: the ad rank of the next competitor divided by your quality score, plus $0.01.
Several factors influence pricing:
Facebook Ads pricing is shaped by metrics related to user behavior. Costs are influenced by factors like audience targeting, campaign goals, ad performance, and seasonal demand. Unlike Google Ads, Facebook doesn’t use keyword bidding or quality scores.
Here’s a comparison of key pricing metrics for Google Ads:
| Metric | Google Ads Range | Example |
|---|---|---|
| General CPC Range | $0.11–$0.50 | Technology SaaS: $3–$5 |
| Premium Industry CPC | $8–$12 | Legal Services: $8–$12 |
| Mid-Range Industry CPC | $3–$6 | Real Estate: $4–$6 |
| Basic Industry CPC | $1–$3 | eCommerce: $1–$3 |
"Google Ads determines your CPC by looking at your ad's overall quality and how it compares to your competitors' ads for that particular search. Specifically, Google will consider your ad's relevance to the keyword, its expected click-through rate for that keyword, and what the overall landing page experience is like for people who search that keyword."
- Kayla J., Internet Marketing Specialist
A revealing statistic shows that 61% of businesses keep their Google Ads CPC between $0.11 and $0.50. To ensure better results, Google Ads’ automated strategies usually need 30–50 conversions per month to move past the learning phase. Without enough conversions, costs can rise, and ROI may drop.
These insights provide a solid foundation for understanding how to allocate and optimize your advertising budget.
Google Ads relies on search intent and keywords to connect with users actively looking for specific products or services. It allows targeting based on keywords, location, demographics, and device type. This focused approach often leads to higher costs per click, averaging around $1.00.
Facebook Ads leverages its vast user data to offer highly detailed targeting. It allows advertisers to reach audiences through demographics, interests, behaviors, and custom audiences. This broader targeting capability results in a lower average cost per click, approximately $0.26.
When comparing these platforms, the differences in costs and conversion quality become clear. Here's a quick breakdown:
| Targeting Aspect | Google Ads | Facebook Ads |
|---|---|---|
| Primary Focus | Search Intent | User Behavior |
| Average CPC | $1.00 | $0.26 |
| Best For | Direct Response | Brand Awareness |
| Audience Intent | Active Searchers | Passive Browsers |
Real-world campaigns highlight how targeting impacts costs and results:
The secret to cost-effective advertising lies in matching your strategy to your goals. Google Ads excels at driving immediate conversions through high-intent searches, while Facebook Ads is ideal for building long-term brand recognition.
Google Ads provides a range of formats tailored to different marketing goals. Performance Max campaigns, for example, offer broad targeting options. Below is an overview of the main ad formats, their costs, and best use cases:
| Ad Format | Average CPC | Average CPM | Best Use Case |
|---|---|---|---|
| Search Ads | $1-$4 | $5-$8 | Direct response |
| Display Ads | $0.50-$1 | $3-$5 | Building awareness |
| Video Ads | $2-$3 | $6-$10 | Driving engagement |
| Shopping Ads | $0.75-$2.50 | $4-$7 | Promoting products |
| Performance Max | $1.50-$4 | $5-$12 | Reaching across channels |
Facebook Ads excel at showcasing visual content across its ecosystem, which includes apps like Instagram. With a massive user base of 3.065 billion daily active users, advertisers can tap into diverse audiences. Here's a breakdown of Facebook ad formats and costs:
| Ad Format | Average CPC | Average CPM | Best Use Case |
|---|---|---|---|
| Single Image | $0.26-$0.28 | $1.01-$2.00 | Delivering brand messages |
| Video Ads | $0.28-$0.30 | $2.00-$3.00 | Telling stories |
| Carousel Ads | $0.27-$0.29 | $1.50-$2.50 | Showcasing products |
| Story Ads | $0.28-$0.30 | $2.50-$3.00 | Boosting engagement |
Analyzing pricing and targeting, it's clear that each platform offers unique advantages depending on campaign goals. Barry Martin, President & Creative Director of The Idea Center, highlights the value of combining platforms:
"We believe using both is best, because you reach both an active and passive audience. Active searchers are hotter prospects, so we recommend using 75% of the budget for active searchers and 25% for the passive audience, depending on the client." - Barry Martin
Here's how these platforms performed in real-world campaigns:
1. High-Intent Search Campaign
A Google Ads campaign for an eye care group generated 372,000 impressions, 22,820 clicks, and achieved a 15.07% conversion rate.
2. Brand Awareness Campaign
A Facebook volunteer recruitment campaign reached 128,000 people, resulting in 3,076 unique click-throughs at just $0.24 per click.
"If high intent exists, Google Ads would be my first port of call and should be a priority. If the brand in question is in need of brand awareness or is especially visually driven, Facebook Ads tends to work better as a starting point."
For intent-driven results, Google Ads is the go-to choice, despite its higher costs. For visually engaging, cost-efficient campaigns, Facebook Ads is often the better option. These examples highlight the strengths of each platform depending on your goals.
Managing costs on Google Ads requires precise targeting and well-structured campaigns. One effective tactic is narrowing geographic targeting by switching from "Presence or Interest" to "Presence" only. This helps avoid spending on less relevant audiences.
Separating brand and non-brand keywords into separate campaigns can also make a big difference. Brand campaigns often see conversion rates go up by 40% when isolated, while non-brand campaigns may experience a 20% increase in click-through rates and up to a 300% boost in acquiring new customers.
Tools like Eliminate Wasted Spend offer automated solutions to combat click fraud, refine keyword performance, maintain negative keyword lists, track conversion values, and protect your budget.
Cost control on Facebook Ads focuses on fine-tuning audience targeting and improving ad creatives. The platform's advanced targeting options can lead to more efficient spending.
For example, Raymond, a men’s clothing retailer, achieved a 78% increase in in-store sales and a 58% rise in foot traffic by targeting campaigns at recently engaged or newly employed men.
To get the most out of Facebook Ads:
Once you’ve refined your cost controls, the next step is managing your overall budget.
Using the right tools is essential for monitoring and optimizing ad spend. Here's a quick comparison of strategies for Google Ads and Facebook Ads:
| Strategy | Google Ads | Facebook Ads |
|---|---|---|
| Bidding Strategy | Manual bidding with CPC caps (using tROAS or tCPA) | Automated bidding based on platform suggestions |
| Campaign Structure | Separate brand and non-brand campaigns; use SKAGs | Manage budgets at the ad set level |
| Performance Tracking | Track conversion value with focused conversion events | Optimize attribution windows and measure results |
Small businesses often see dramatic results from optimization. One case study showed cost per conversion dropping from $284 to $16.87 (a 94.1% decrease), CPC falling from $13.88 to $4.27 (a 68.08% reduction), and conversion rates improving from 3.41% to 26.06% (a 764% increase).
For e-commerce businesses, using a Target Return on Ad Spend (tROAS) bidding strategy has led to over 40% improvements in both conversion rates and ROAS. Pair this with effective conversion tracking and negative keyword strategies, and you’ll have a strong framework for cost-efficient advertising.
Based on the metrics discussed earlier, Google Ads tends to deliver results driven by user intent but at a higher cost (average CPC: $1–$4). On the other hand, Facebook Ads offers lower CPCs (around $0.26–$0.30) and focuses on targeting users based on demographics and interests.
Here’s a quick comparison of the two platforms:
| Metric | Google Ads | Facebook Ads |
|---|---|---|
| Average CPM | $5 – $12 | $1.01 – $3.00 |
| Targeting Approach | Search intent | Demographics & interests |
| Minimum Monthly Budget | $500 | $100 |
| Best Use Case | Direct response campaigns | Brand awareness efforts |
Choosing the right platform depends on your advertising goals.
"Ads that perform their best in our auction combine five components: the right objective, targeting, a sufficient budget, enough duration and compelling ad creative." – Facebook
Looking ahead, advertising costs are expected to shift, and budgets should be adjusted accordingly. For Google Ads, small to mid-sized businesses will likely need to allocate $500 to $10,000 monthly, with competitive industries requiring larger investments. Facebook Ads budgets typically range from $100 to $500 monthly, with daily minimums depending on the campaign objective:
Costs can vary significantly by industry. For instance, legal services average $8.50 per lead CPC, while restaurant campaigns may cost as little as $0.51. Additionally, advertisers should prepare for temporary cost spikes on Facebook during peak shopping seasons due to increased competition. These predictions highlight the importance of balancing performance with budget as advertising trends continue to evolve.